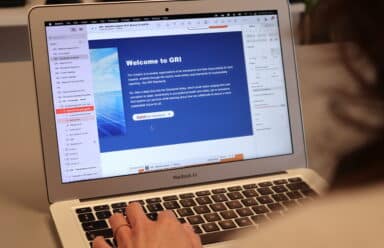
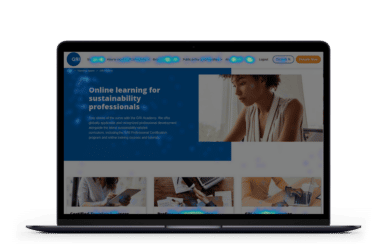
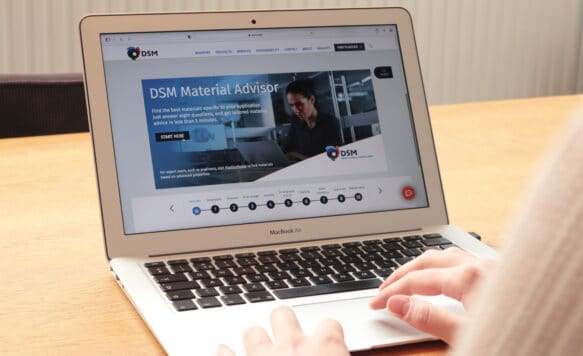
The nonprofit organization GRI asked us to manage the redesign of their website in 2021. After our new design successfully went live, only some final improvements remained due to a lack of resources. Ultimately, the redesigned website led to a surprising insight: it turned out to be much more important than they had previously thought.
This insight raised new questions for the NPO, because: how do we actually find out how the user experiences our website? Does the end user of our website find what he is looking for? How do we use design to improve the user experience? And how do we, as a web team, manage the UX of our website and all the wishes that different stakeholders have? This was a new challenge that we, as GriDD, naturally embraced.
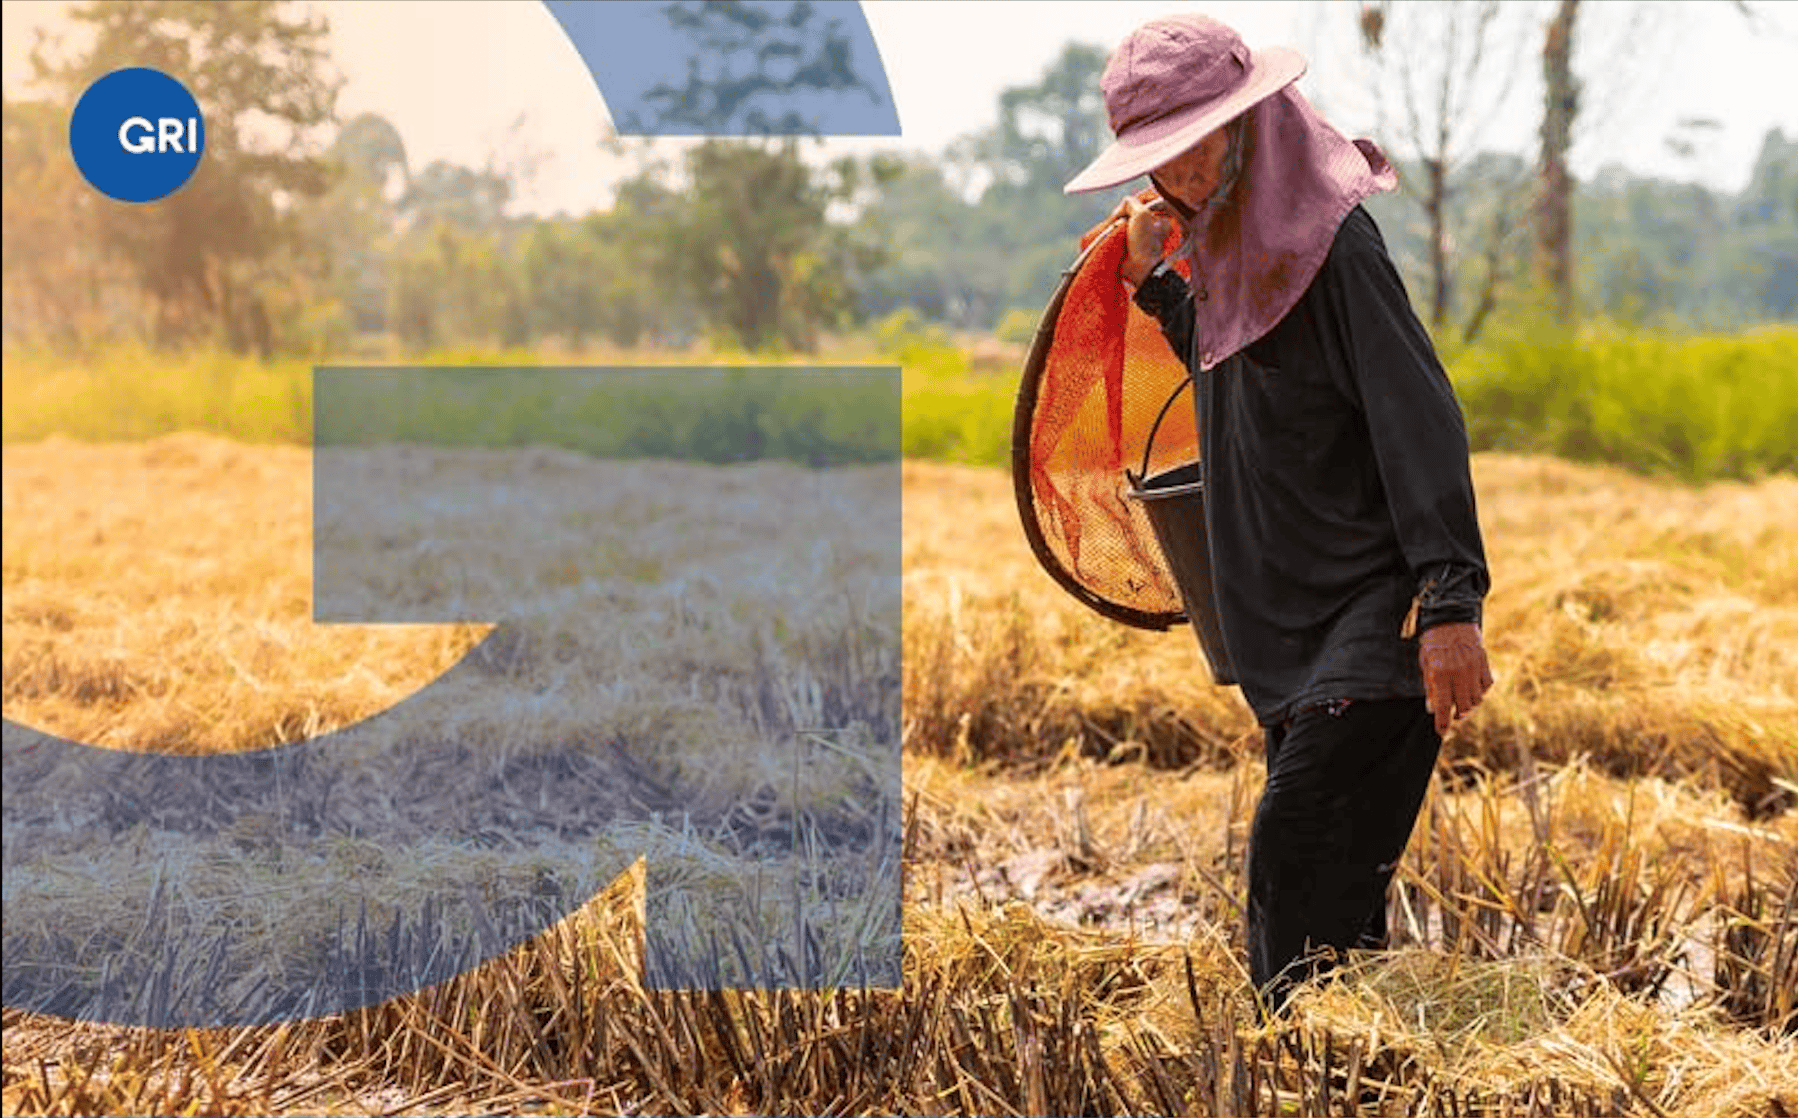
GRI is a non-profit organization that develops guidelines by which one can measure a company’s sustainability. This provides the word “sustainability” with a meaning and a foundation. The guidelines are available as free downloads, and based on them one can compile reports. As creating such a report is complex, GRI offers training courses in order to assist people. As an example, reporting results help companies understand and communicate their impact on climate change.
GRI has a high-traffic website, but due to some complications with Google Analytics, these visits did not provide usable data. Since collecting usable date is crucial in improving the user experience, adding tracking and using behavioural analytics was the first step. We equipped the web team with additional UX tools and later also with more knowledge. After all, how do you read data and interpret it correctly?
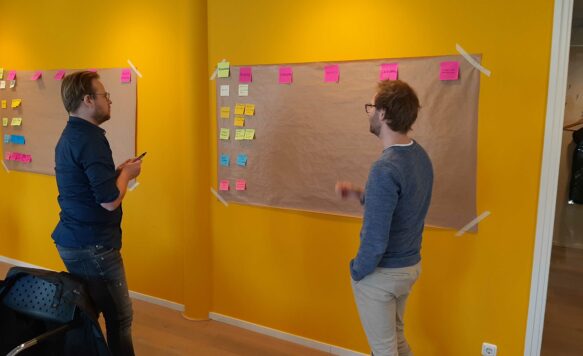
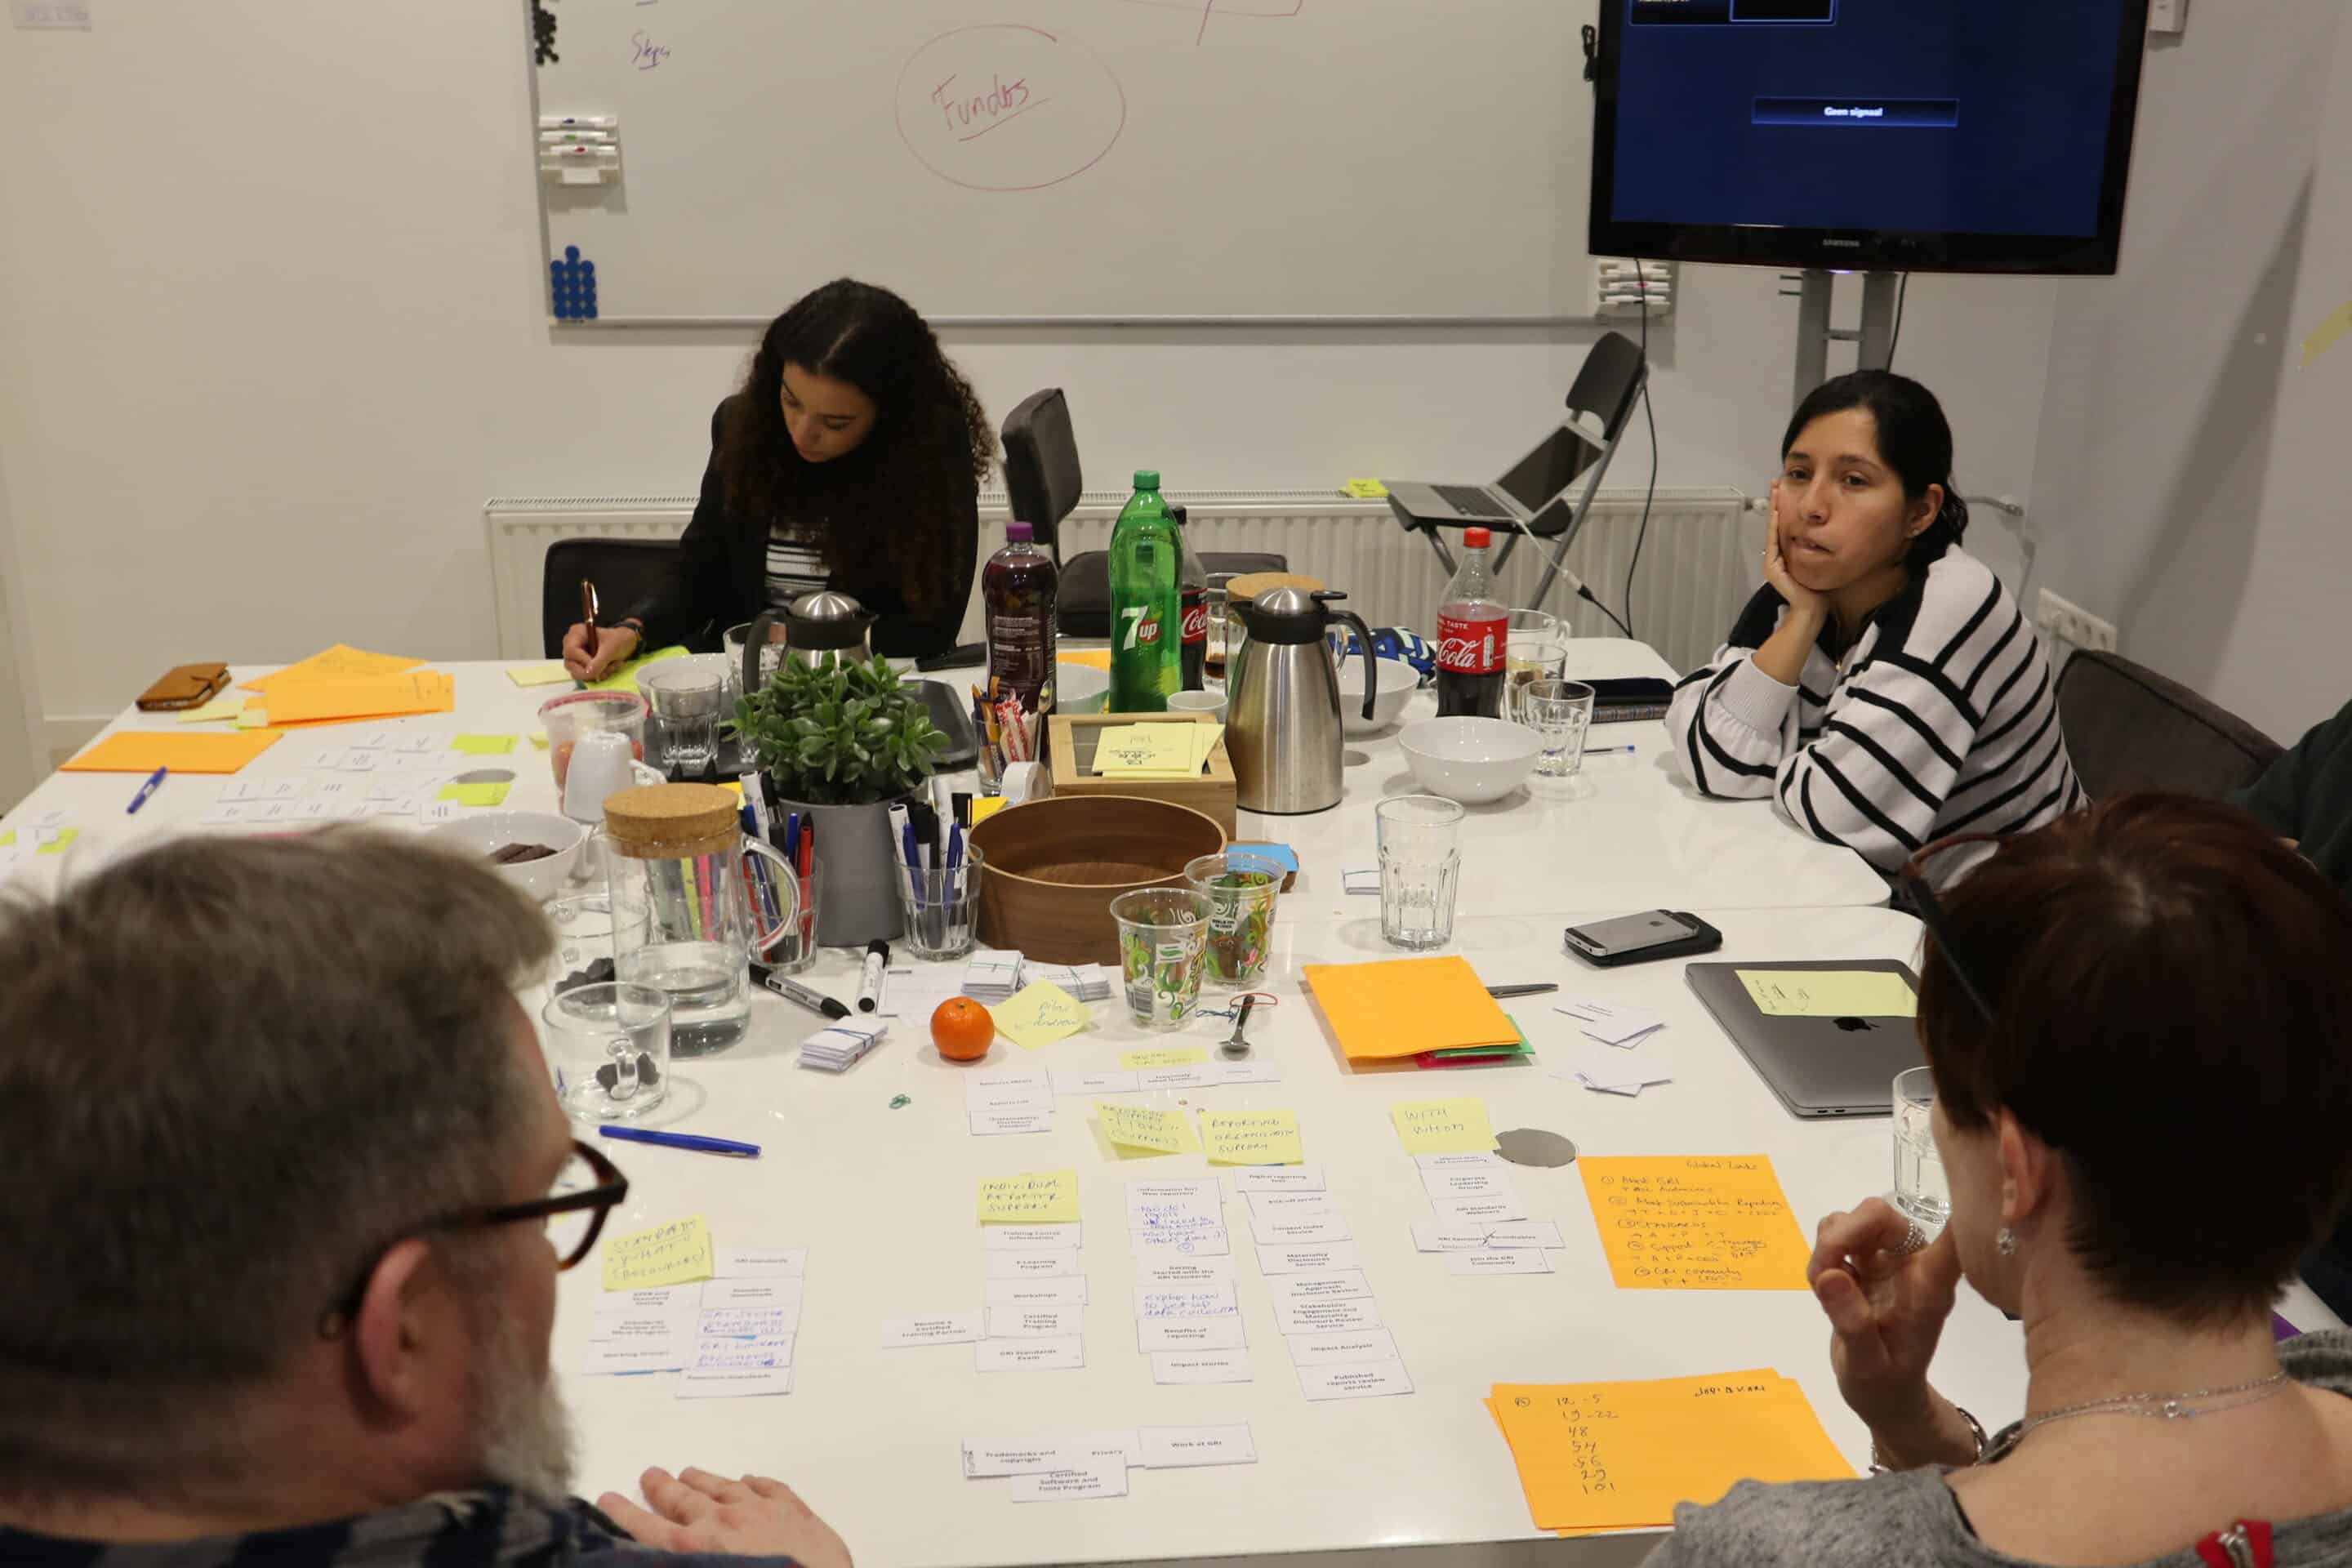
Another challenge for the web team was managing stakeholders. GRI has hubs all over the world, and from all those hubs there are directors who want a say on the website. Very logical, but how do you decide which questions to accept or reject and what priority to give to requests? You can’t do everything at once. The web team was looking for a system to create more peace in the department and to handle requests based on arguments, so that changes truly contribute to the quality of the website.
The first stop for our UX consultant was the low-hanging fruit: fixing small design bugs such as a font that didn't correspond properly and implementing a standard icon set. This immediately improved the readability of the website and made using icons easier for the web team.
Next, our UX consultant started working with the web team on the UX. To get as much out of this as possible, we suggested using Hotjar. Hotjar is an analytics tool that helps you collect quality user data. As the website has a high number of visitors, it quickly provided an awful lot of useful data. Additionally, the conducted survey provided more data. For example, it turned out that there were download problems on the website, which is precisely the kind of information that our UX consultant can start working with immediately.
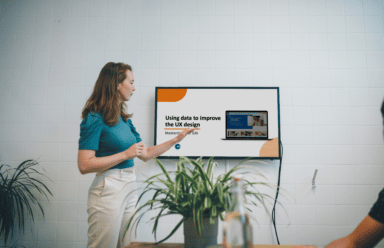
Since reading and interpreting Hotjar data is not easy, we organized a three-hour master class on this topic for the web team. They can now work independently on the user experience and use this data for stakeholder management. If a stakeholder makes a request for the website, the web team now has data to support and justify their decisions.
Working with the web team, guidance from GriDD and data from Hotjar, we achieved beautiful and interesting results:
It’s interesting to see how actionable and useful data has the ability to transform a website. Furthermore, how this information helps the web team to be accountable to stakeholders. When a few thousand people fill out a survey and you also have the data from Hotjar, it gives you solid leverage. Ultimately, it just proves again that the user is the most important person to listen to.